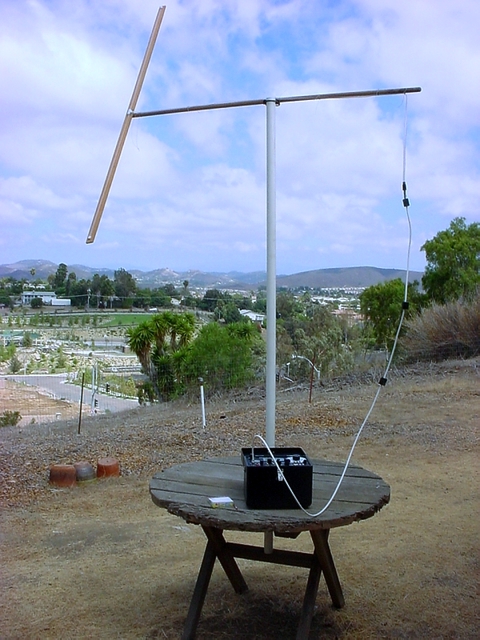

I used this test setup to measure the axial ratio of circularly polarized FM broadcast signals. A piece of wood supports a folded dipole whose tilt angle I varied with a stick. The boom is wood and the mast is PVC. Twinlead with an integral 300Ω balun connects to a few feet of RG-6. Three ferrite chokes suppress coax shield current. The center of the dipole is 99″ above ground. The black box is a Wavetek SAM, a portable RF level meter.
I made the measurements from a hilltop 700 feet above sea level seven miles from the coast in northern San Diego County. I measured signals from San Diego, the greater Los Angeles area, and Santa Barbara. The horizon to the south is a range of low hills a few miles away. From north to northwest it is a mountain range 17–26 miles away. To Santa Barbara it is the ocean. Reflections were possible from hills in other directions and from my house, but nothing nearby obstructed signals.
With the antenna horizontal I rotated the mast for maximum signal. Then I adjusted the tilt from −90° to +90° and recorded the maximum variation in RF level. I didn't record the tilt angle for maximum signal, but it varied greatly. Finally, I calculated two gain figures from the measured axial ratio.
 Station  Frequency  Distance  Bearing  Axial Ratio  Typical Gain  Maximum Gain
         MHz      miles      deg        dB            dB           dB
KKJZ       88.1       71       310         2           2.1          2.1
KSBR       88.5       34       318         8          -0.1          0.6
KUSC       91.5       89       327         4           1.2          1.5
KDB        93.7      168       304         4           1.2          1.5
KMYI       94.1       21       186         7           0.2          0.8
KFRG       95.1       73       357         5           0.9          1.2
KLOS       95.5       90       327         1           2.5          2.5
KSON       97.3       30       164         4           1.2          1.5
KLYY       97.5       76         3         6           0.5          1.0
KIFM       98.1       21       186         6           0.5          1.0
KOLA       99.9       57       356         1           2.5          2.5
KIOZ      105.3       21       186         7           0.2          0.8
KALI      106.3       56       319         6           0.5          1.0
KWVE      107.9       43       335         5           0.9          1.2
                                Average      4.7          1.0          1.4
Typical gain is for a receive antenna with an axial ratio of 0 dB. Maximum gain is for a receiver that combines the orthogonal signals with optimal weighting coefficients. The gain reference is the signal level along the major axis of the polarization ellipse. If the antenna consists of crossed Yagis, this is the response of a single Yagi when tilted for maximum signal.
To estimate the gain over a single horizontal Yagi, assume that the signal tilt angle is randomly distributed. A stochastic simulation using the measured axial ratios yielded an average response 2.5 dB below the major-axis response. So for the signals I measured, typical gain of circularly polarized crossed Yagis over a single horizontal Yagi should average 3.5 dB and maximum gain should average 3.9 dB.

KWVE in Orange County was the only station within line of sight. This elevation profile to the tower illustrates the terrain irregularity and the many opportunities for signal diffraction. Each can differentially alter the orthogonal fields and contribute to polarization noncircularity. The vertical scale exaggerates by a factor of five.
 88–108 MHz